This is a guest post by Amir Szitenberg, a postdoc in my lab @EvoHull, describing a phylogenomic investigation using ReproPhylo. Amir used to be a sponge researcher if you can’t tell from the tone below. Despite already knowing ReproPhylo could do all this rapidly and of course reproducibly, I was still both surprised and impressed by the scale and speed of Amir’s re-analyses.
My prejudice about early branching Metazoa
The most recent paper about the sister clade of Metazoa (Whelan et al. 2015), like its predecessor (Moroz et al. 2014), places Ctenophora as the first branching metazoan phylum. I have been out of touch with the topic for about three years (might as well been an eternity with the rate genomes are being sequenced) but I felt I had to do something about those cheeky party-crashing beasts (spoiler alert, they are still there, having sangrias on the earliest branch of the tree). More than that, I wanted to see how it feels to run a full-scale genomic dataset through ReproPhylo.
Whelan et al. (2015) go to great lengths in controlling for paralogy, long branch attraction, and AA heterogeneity, but the two things I found particularly intriguing were the way they control for evolutionary rate by removing the slowest evolving genes from one of their datasets, and their avoidance of a ribosomal proteins over-representation.
They recover a very robust signal placing Ctenophora branching at the base of Metazoa, and they make a point that older studies, such as the one of Philippe at al. (2009) rather find Porifera as the early branching phylum because of the over-representation of the structurally constrained ribosomal proteins. But could it be that ribosomal proteins disagree with other loci because they are slow evolving and therefore more reliable?
Plan of action
Take dataset 12 from Whelan at al. (2015) (most inclusive in species sampling, least inclusive in suspected paralogous loci) and check the change of the topology as I gradually change the loci entropy (Shannon, 2001) range in the dataset. Also, take the dataset from Philippe at al. (2009), exclude ribosomal proteins, but only use loci that are as slowly evolving as ribosomal proteins. In short, run a finer scale check of the effect of locus evolutionary rate (quantified with Shannon entropy) on the tree topology.
Why this feels like a reproducibility success
At this point I have to say that although I failed miserably at reshaping the metazoan phylogenetic history to my liking, this little reanalysis was a positive experience. First, for both publications (Whelan and Philippe) the data is accessible and very nicely laid out, including the sequence alignment and data partition information. This is not a trivial thing as often journals allow authors to get away with providing only SRA accession numbers. Want to re-analyse? A year of work is in store for you before you get sequence alignments and you have no guarantee that your alignments are the same as the ones used by the authors. Second, ReproPhylo seemed to just behave and do as it was told. Twenty minutes of setting up without (almost, see next) any custom functions required, and by my next encounter with my laptop I had the nicely annotated trees and box-plots you see here, although the analysis was fairly complex, including multiple forks with parameter and data composition variations.
The soft belly (hence the ‘almost’), was the format in which partition data was provided. We worry a lot about standard formats for sequence data, sequence alignments and trees, but not as much about the way data partitions are described. ReproPhylo can handle partitions if they are separated in advance, or if the info is in PAUP format within a nexus file. However, many other popular formats for data partitions are used. Whelan et al. provide the relevant section from the FASconCAT (Kück Meusemann, 2010) log file, a very popular program. Philippe et al. (2009) provide the info in a MrBayes (Ronquist and Huelsenbeck, 2003) style nexus file, with the gene names as a comment line. In both cases, it was straightforward to modify the function that reads a nexus file with PAUP style partitions to accommodate the data at hand. These modifications would be widely applicable, I guess, if included in ReproPhylo, but it did make me think about best practices and all of that.
Results
The analysis, phylogenetic methods, and results are available here and include an html report, a Project file, a notebook for each of the datasets, some alignment and tree files, as well as a figures directory for each of the datasets. Just a quick credit is in order for the programs used, which are RAxML (Stamatakis 2014), MAFFT (Katoh et al. 2013) and TrimAl (Capella-Gutiérrez et al. 2009). The 210 loci from from Whelan et al. (2015) were sorted by median entropy and then divided into four subsets of 50 loci, and another one of 10, with different median entropy ranges. The 150 loci long Philippe et al. (2009) dataset was also sorted by entropy and divided to three subsets of loci with different entropy ranges. Additional Philippe et al. subset included only the 50 slowest evolving, non ribosomal-protein loci. Table 1 describes all of this in an organized manner. I tried some additional subsetting tactics which can be seen in the notebooks but which I will not discuss here.
Table 1. The dataset subsets used for phylogenetic reconstruction
| Dataset | Publication | Loci | Mean entropy |
|---|---|---|---|
| 1 | Whelan | 1-50 | 2.44-1.83 |
| 2 | Whelan | 51-100 | 1.83-1.48 |
| 3 | Whelan | 101-150 | 1.47-1.07 |
| 4 | Whelan | 151-200 | 1.07-0.38 |
| 5 | Whelan | 201-210 | 0.38-0.16 |
| 6 | Philippe | 1-50 | 1.99-1.24 |
| 7 | Philippe | 51-100 | 1.22-0.75 |
| 8 | Philippe | 101-151 | 0.73-0.00 |
| 9 | Philippe | 50 lowest entropy that are not RP | 0.99-0.15 |
RP = ribosomal proteins
In the Whelan et al. (2015) dataset, mean entropy ranged between 0.16 and 2.44 and was not biased by missing data (quantified by gap scores and sequence lengths; Figure 1).
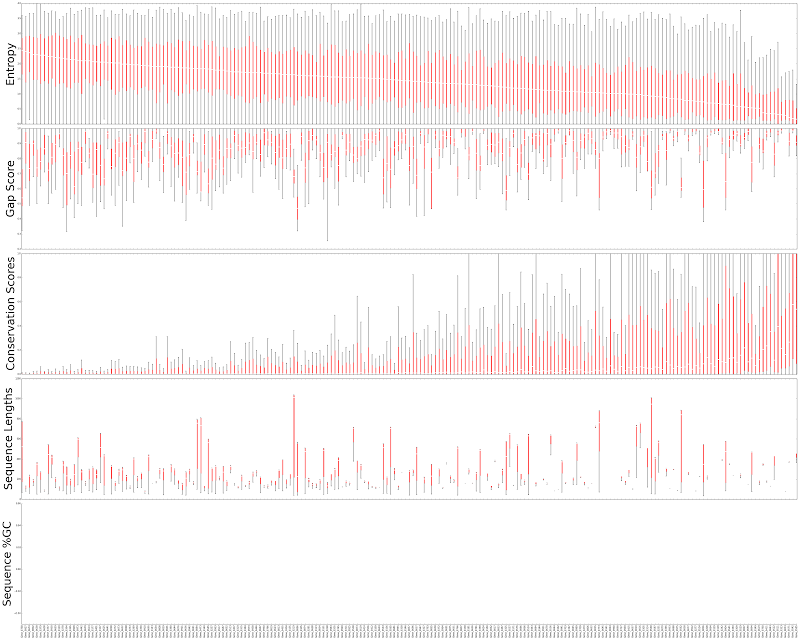
Figure 1. Locus statistics distributions for loci in the Whelan et al. 2015 dataset. From top to bottom, each box plot represent the distribution of entropy, gap score, conservation score and sequence length in one locus. Since the dataset is of protein sequences there is no %GC information. Entropy does not seem correlated with other statistics with the exception of conservation scores. Median entropy ranges between 0.16 and 2.44.
Throughout all the tree figures ReproPhylo has automatically coloured the Ctenophora pink, sponges purple, Cnidaria yellow, Placazoa green, bilatarians and outgroups white following the colour scheme of Whelan et al. All the five loci subsets in the Whelan et al. (2015) dataset recovered Ctenophora as as the sister clade of Metazoa. The tree constructed from the most fast evolving loci is in Figure 2.
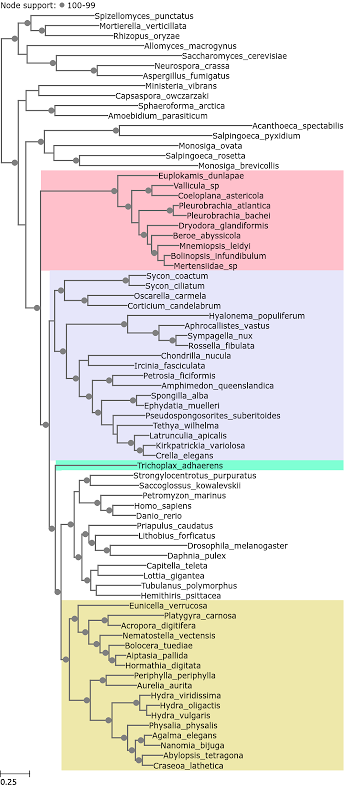
Figure 2. A phylogenetic tree reconstructed from Whelan et al. 2015 loci with median entropy of 1.83 – 2.44.
Ctenophora were also recovered as the earliest branching metazoan lineage in the Philippe et al. (2009) dataset when the 50 fastest evolving loci were used. It was not recovered as such with the 50 slowest evolving ones. Half of these loci are ribosomal proteins (Figure 3).
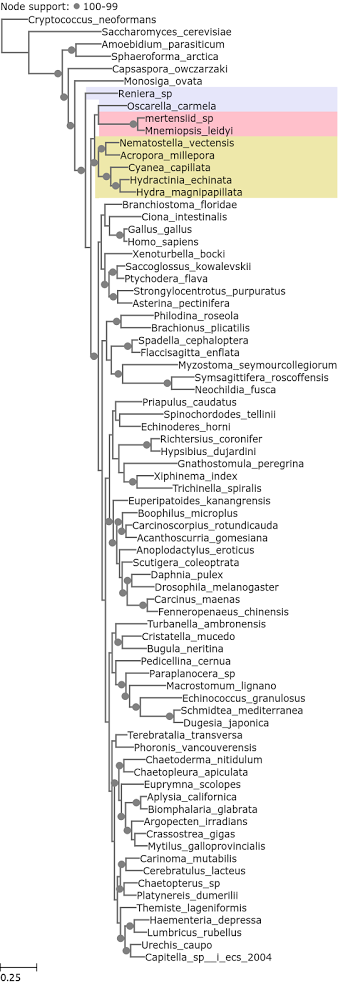
Figure 3. A phylogenetic tree reconstructed from Philippe et al. 2009 loci with median entropy of 0 – 0.73.
When ribosomal proteins are excluded, the 50 slowest evolving do yield Ctenophora as the earliest branching metazoan phylum (Figure 4). Although the entropy range is different. The slowest evolving ribosomal protein has a 0 median entropy value, and the slowest evolving non ribosomal protein has a median entropy value of 0.15, which is comparable with the slowest evolving gene in the Whelan et al. (2015) dataset (0.15 and 0.16 respectively).
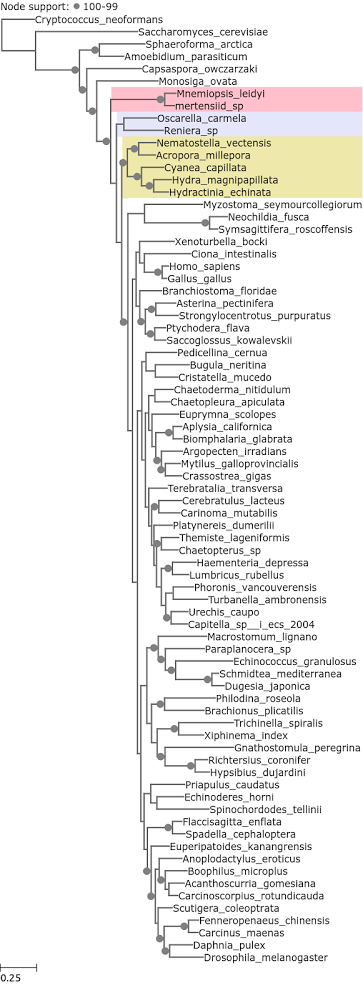
Figure 4. A phylogenetic tree reconstructed from Philippe et al. 2009 loci with median entropy of 0.15 – 0.99, no ribosomal proteins.
So:
As Whelan et al. (2015) claim, ribosomal proteins conflict with the otherwise very robust signal placing ctenophores at the base of the metazoan tree. It could be claimed that since on top of being structurally constrained (aren’t all proteins?), they are also the slowest evolving, and are therefore more reliable, rather than causing a bias. However, it is hard to ignore the otherwise impressive consistency of Ctenophora’s position in the tree, when the ribosomal proteins are excluded.
But my main point here really is to show how efficient and effective a reanalysis can be if the data is accessible, and with a tool like ReproPhylo at our finger tips. Truly, I spent by far much more time writing this post than I did running the analysis, which, mind you, without any effort on my part, produced the Git repositories (available as zipped folders in figshare) and a human readable output containing an html report, scripts, data files and figures (also in figshare).
ReproPhylo webpage, ReproPhylo github, ReproPhylo manual
@ReproPhylo twitter
References
Capella-Gutiérrez, Salvador, José M. Silla-Martínez, and Toni Gabaldón. “trimAl: a tool for automated alignment trimming in large-scale phylogenetic analyses.” Bioinformatics 25, no. 15 (2009): 1972-1973.
Katoh, Kazutaka, and Daron M. Standley. “MAFFT multiple sequence alignment software version 7: improvements in performance and usability.”Molecular biology and evolution 30, no. 4 (2013): 772-780.
Kück, Patrick, and Karen Meusemann. “FASconCAT: convenient handling of data matrices.” Molecular Phylogenetics and Evolution 56, no. 3 (2010): 1115-1118.
Moroz, Leonid L. “Convergent evolution of neural systems in ctenophores.” The Journal of experimental biology 218, no. 4 (2015): 598-611.
Philippe, Hervé, Romain Derelle, Philippe Lopez, Kerstin Pick, Carole Borchiellini, Nicole Boury-Esnault, Jean Vacelet et al. “Phylogenomics revives traditional views on deep animal relationships.” Current Biology 19, no. 8 (2009): 706-712.
Ronquist, Fredrik, and John P. Huelsenbeck. “MrBayes 3: Bayesian phylogenetic inference under mixed models.” Bioinformatics 19, no. 12 (2003): 1572-1574.
Stamatakis, Alexandros. “RAxML version 8: a tool for phylogenetic analysis and post-analysis of large phylogenies.” Bioinformatics 30, no. 9 (2014): 1312-1313.
Shannon, Claude Elwood. “A mathematical theory of communication.” ACM SIGMOBILE Mobile Computing and Communications Review 5, no. 1 (2001): 3-55.
Whelan, Nathan V., Kevin M. Kocot, Leonid L. Moroz, and Kenneth M. Halanych. “Error, signal, and the placement of Ctenophora sister to all other animals.” Proceedings of the National Academy of Sciences 112, no. 18 (2015): 5773-5778.
DOI of this blog post:
Szitenberg, Amir (2015): Reanalyses done for the blog post “Modest reproducibility success”. figshare.
http://dx.doi.org/10.6084/m9.figshare.1456175
Retrieved 16:25, Jun 22, 2015 (GMT)
